While understanding how to correctly use TICK data takes practice and experience, there are some subtle ways TICK may be used as * a method * to identify day type. Range days are the ones that present challenge to trade, if the trader fail to understand the type of the day. Range days usually will have extreme TICKs on both side of the chart, indicating buying and selling exhaustion. Once we see a buy and sell exhaustion on both sides, there is a good probability for the day to stay in that range.
Sell Ex : Selling Exhaustion
Buy EX : Buying Exhaustion
The number next to it is the extreme TICK reading, which is a signature for exhaustion on range days.
Please see chart examples below.
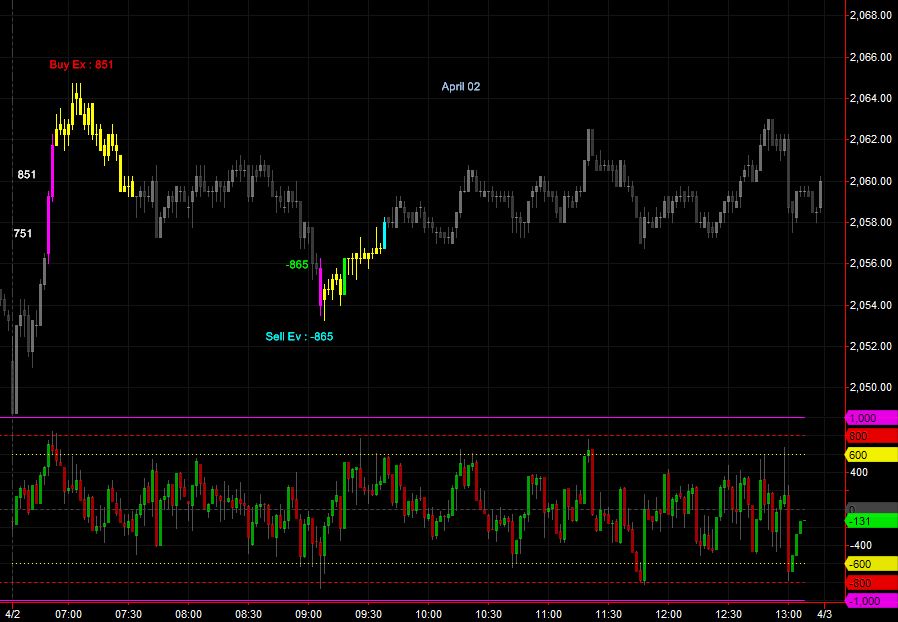
Extreme TICK indicating exhaustion.


